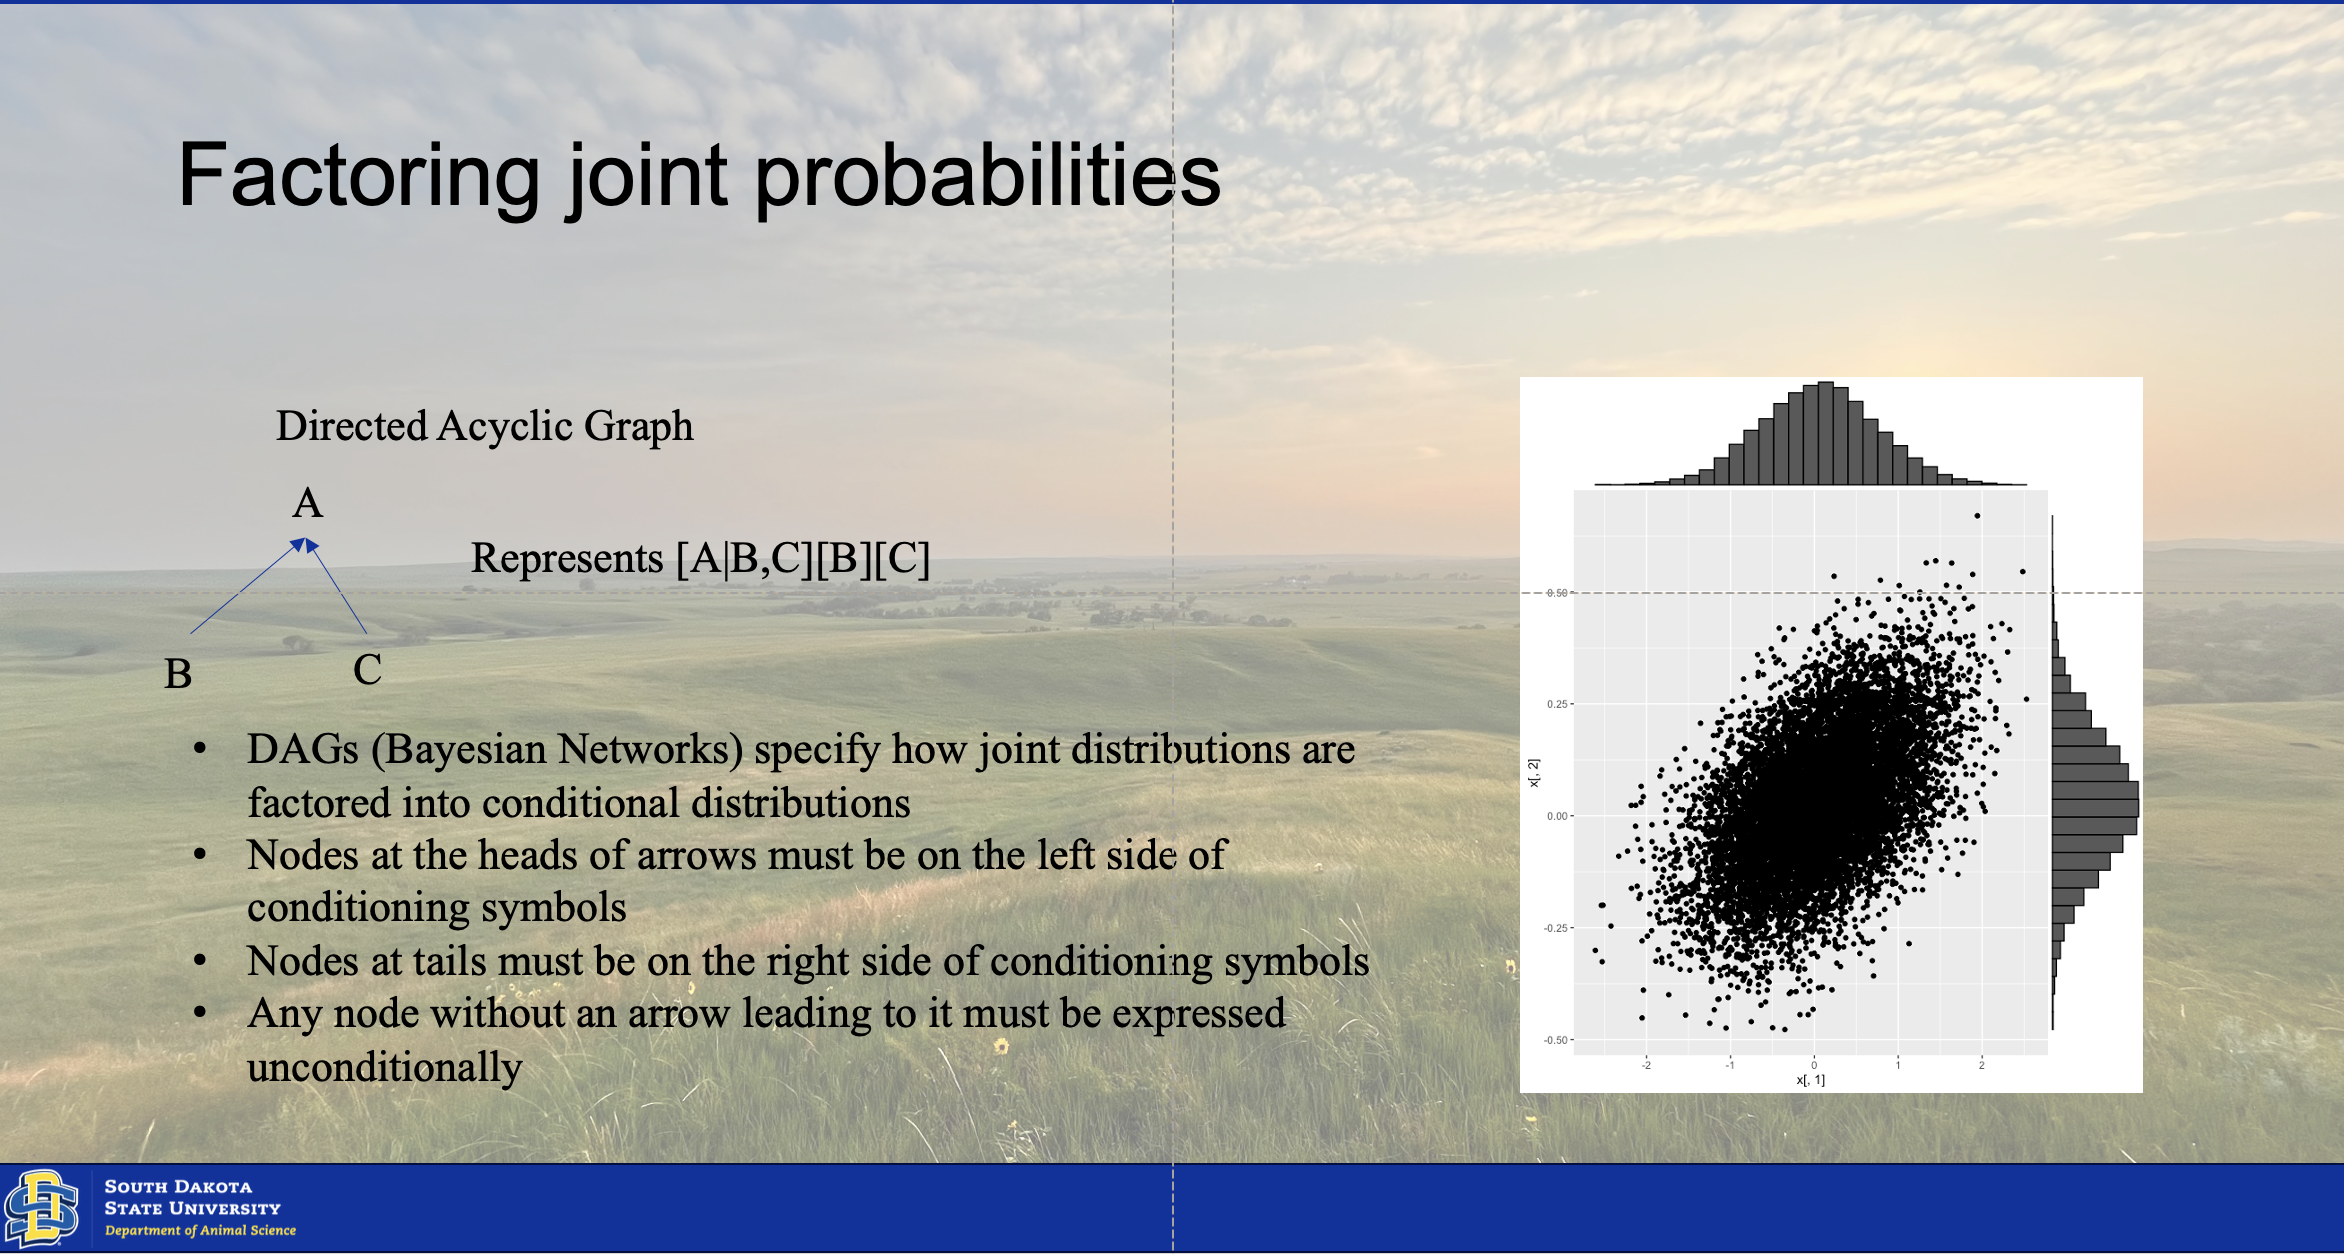
Chapter 5 Joint Distributions
The joint distribution results from the conjugation of two or more posterior distributions of multiple factors or parameters from the model. There are two ways of finding this conjugated distribution. The moments of the two distributions can be matched using calculus If they hold these moments in common. However, this is not always a given, and many times the distributions may not hold moments in common. This is where the computational intensity of Bayesian statistics comes into play. We will utilize a Monte Carlo simulation model to create a simulation of the conjugated distribtution model. We will implement it using a gibbs sampler, typical of the one illustrated below.
5.1 Marcov Monte Carlo
# Set random seed for reproducibility
set.seed(123)

# Parameters for bivariate normal distribution (based on typical livestock data)
mu_fi <- 6.0    # Mean feed intake (kg/day)
mu_adg <- 0.8   # Mean average daily gain (kg/day)
sigma_fi <- 1.0 # Standard deviation for feed intake
sigma_adg <- 0.2 # Standard deviation for ADG
rho <- 0.7      # Correlation coefficient (positive correlation between FI and ADG)

# Function to sample from conditional distribution of feed intake (FI) given ADG
sample_fi_given_adg <- function(adg, mu_fi, mu_adg, sigma_fi, sigma_adg, rho) {
  mean <- mu_fi + rho * (sigma_fi / sigma_adg) * (adg - mu_adg)
  variance <- sigma_fi^2 * (1 - rho^2)
  rnorm(1, mean, sqrt(variance))
}

# Function to sample from conditional distribution of ADG given feed intake (FI)
sample_adg_given_fi <- function(fi, mu_fi, mu_adg, sigma_fi, sigma_adg, rho) {
  mean <- mu_adg + rho * (sigma_adg / sigma_fi) * (fi - mu_fi)
  variance <- sigma_adg^2 * (1 - rho^2)
  rnorm(1, mean, sqrt(variance))
}

# Gibbs sampler function
gibbs_sampler <- function(n_samples, mu_fi, mu_adg, sigma_fi, sigma_adg, rho) {
  samples <- matrix(0, nrow = n_samples, ncol = 2)
  fi <- mu_fi   # Initial value for feed intake
  adg <- mu_adg # Initial value for ADG

  for (i in 1:n_samples) {
    fi <- sample_fi_given_adg(adg, mu_fi, mu_adg, sigma_fi, sigma_adg, rho)
    adg <- sample_adg_given_fi(fi, mu_fi, mu_adg, sigma_fi, sigma_adg, rho)
    samples[i, ] <- c(fi, adg)
  }

  return(samples)
}

# Run the Gibbs sampler
n_samples <- 10000
samples <- gibbs_sampler(n_samples, mu_fi, mu_adg, sigma_fi, sigma_adg, rho)

# Name the columns for clarity
colnames(samples) <- c("Feed_Intake", "ADG")

# Plot the joint distribution (scatter plot)
plot(samples[, "Feed_Intake"], samples[, "ADG"],
     xlab = "Feed Intake (kg/day)", ylab = "Average Daily Gain (kg/day)",
     main = "Joint Distribution of Feed Intake and ADG",
     pch = 20, cex = 0.5, col = rgb(0, 0, 1, alpha = 0.5))
# Plot marginal distributions
par(mfrow = c(1, 2)) # Set up a 1x2 plot layout

# Marginal distribution of Feed Intake
hist(samples[, "Feed_Intake"], breaks = 50, main = "Marginal Distribution of Feed Intake",
     xlab = "Feed Intake (kg/day)", col = "lightblue", probability = TRUE)
lines(density(samples[, "Feed_Intake"]), col = "red", lwd = 2)

# Marginal distribution of ADG
hist(samples[, "ADG"], breaks = 50, main = "Marginal Distribution of ADG",
     xlab = "Average Daily Gain (kg/day)", col = "lightgreen", probability = TRUE)
lines(density(samples[, "ADG"]), col = "red", lwd = 2)

# Reset plot layout
par(mfrow = c(1, 1))
p <- ggplot(NULL, aes(x=samples[,"Feed_Intake"], y=samples[,"ADG"]))+
  geom_point()
# ggMarginal(data = NULL, p = p, x=samples[,"Feed_Intake"], y=samples[,"ADG"], type = "histogram" )
ggMarginal(data = NULL, p = p, x=samples[,"Feed_Intake"], y=samples[,"ADG"], type = "densigram", color = 'blue', fill = 'grey')
## Warning: The dot-dot notation (`..density..`) was deprecated in ggplot2 3.4.0.
## ℹ Please use `after_stat(density)` instead.
## ℹ The deprecated feature was likely used in the ggExtra package.
## Please report the issue at <https://github.com/daattali/ggExtra/issues>.
## This warning is displayed once every 8 hours.
## Call `lifecycle::last_lifecycle_warnings()` to see where this warning was generated.